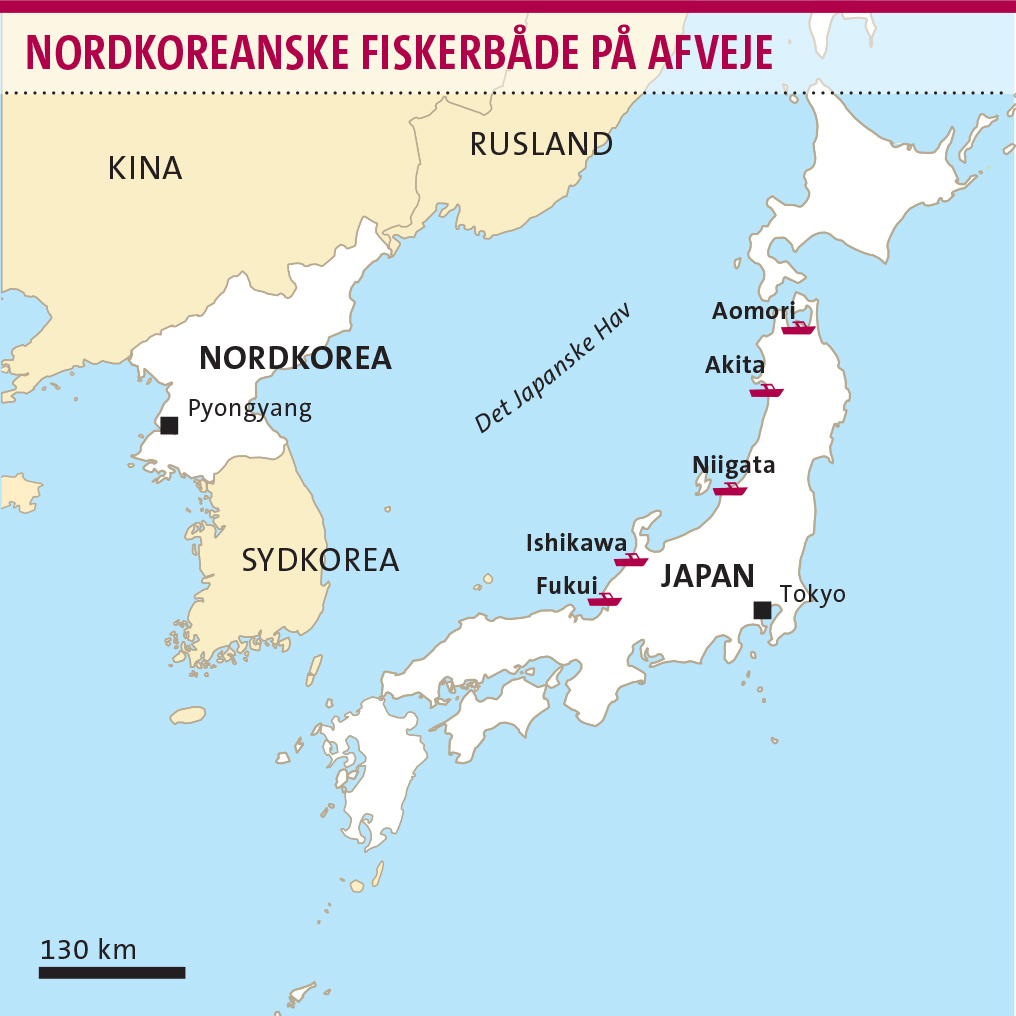
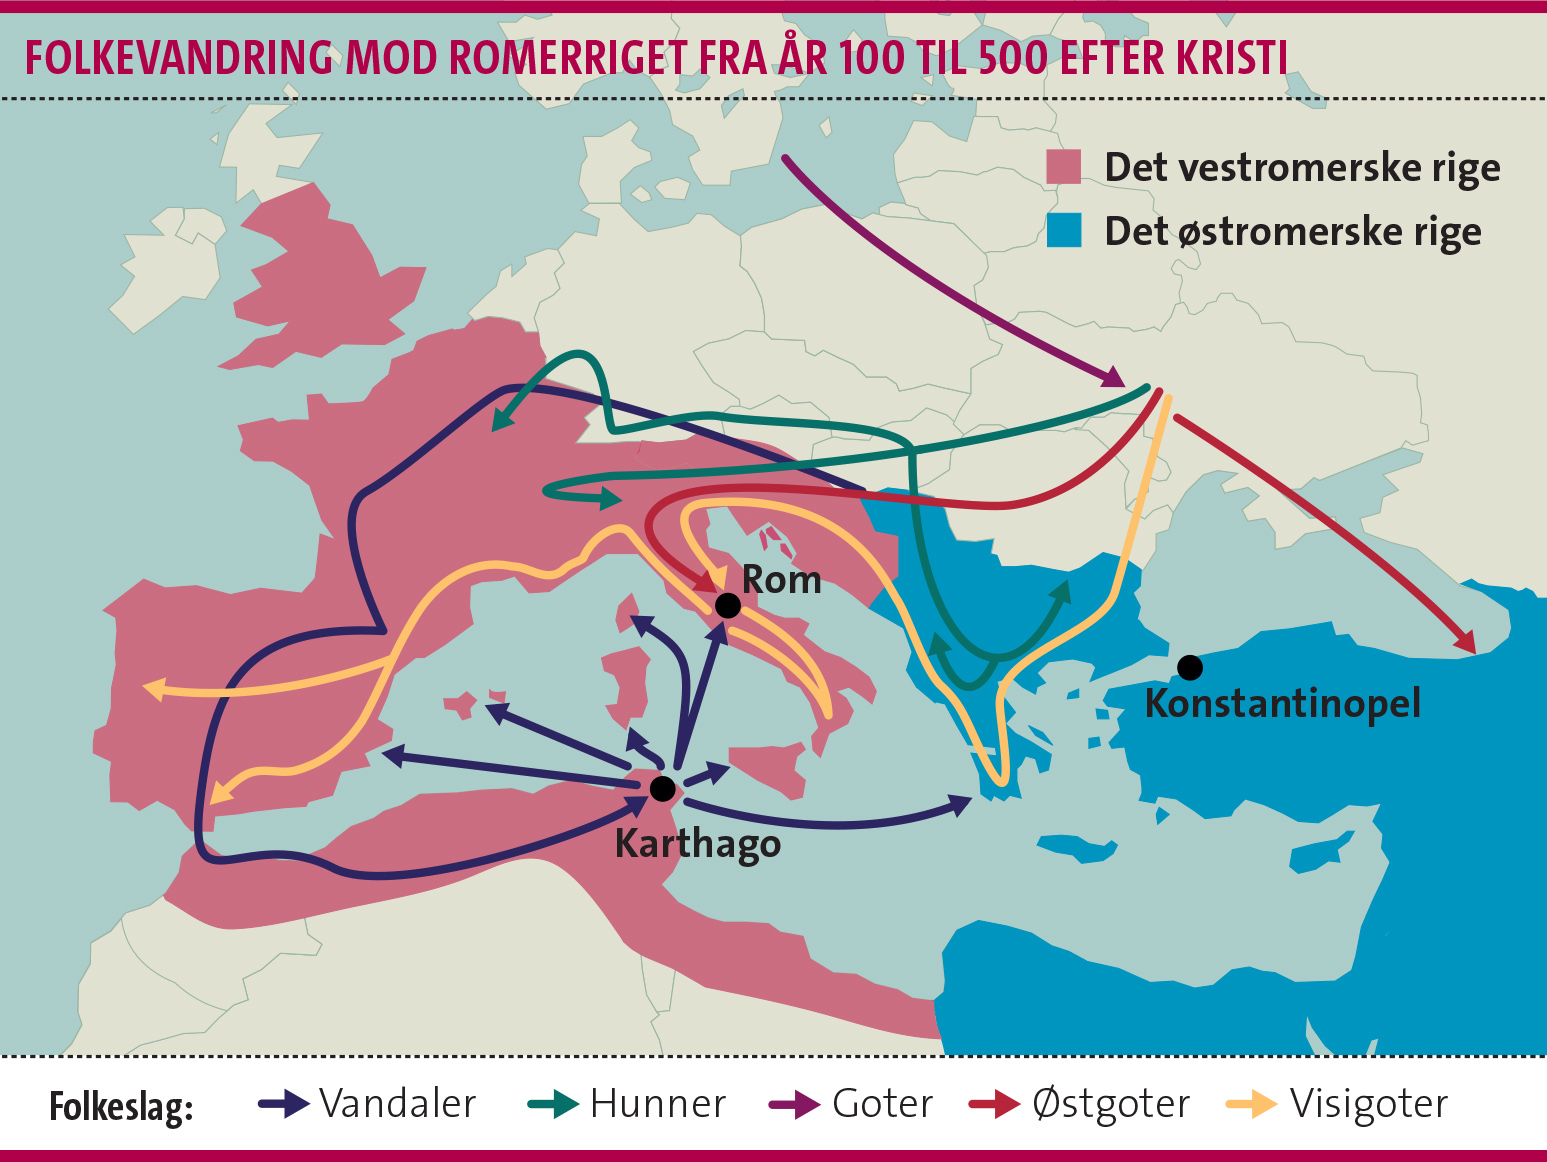
Several daily briefs was given during my time at Kristeligt Dagblad and Berlingske Tidende. The content and data was as diverse as the newspapers them self, dealing with subjects like immigration patterns in the ancient Roman Empire to weekly feature graphics concerning the stockmarket.
Challenge
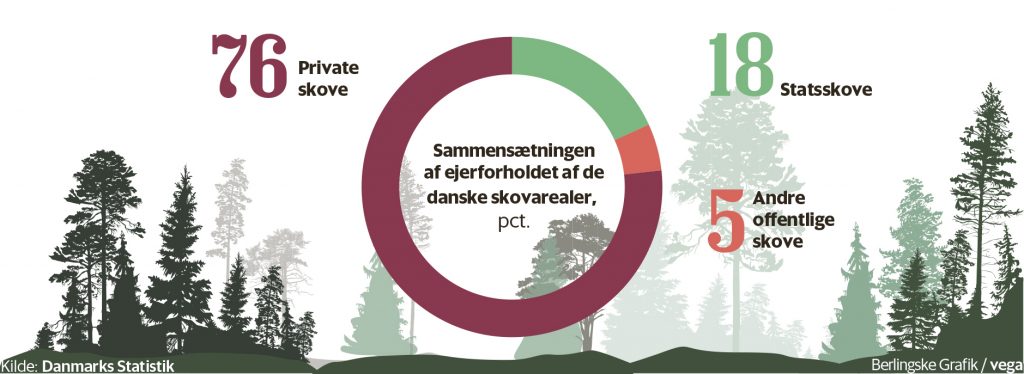
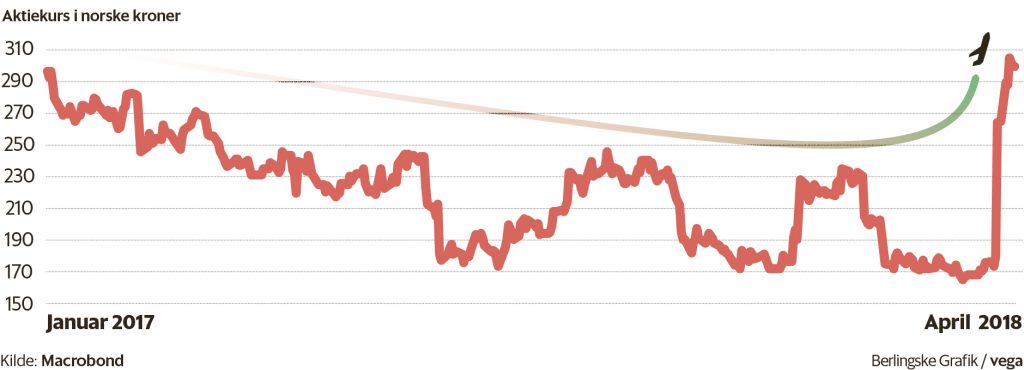
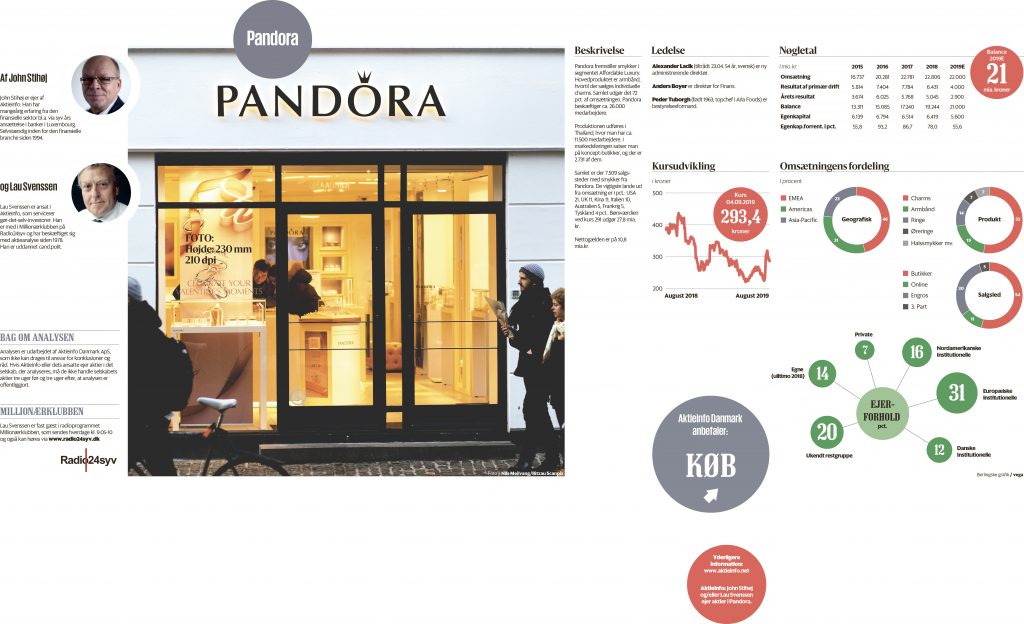
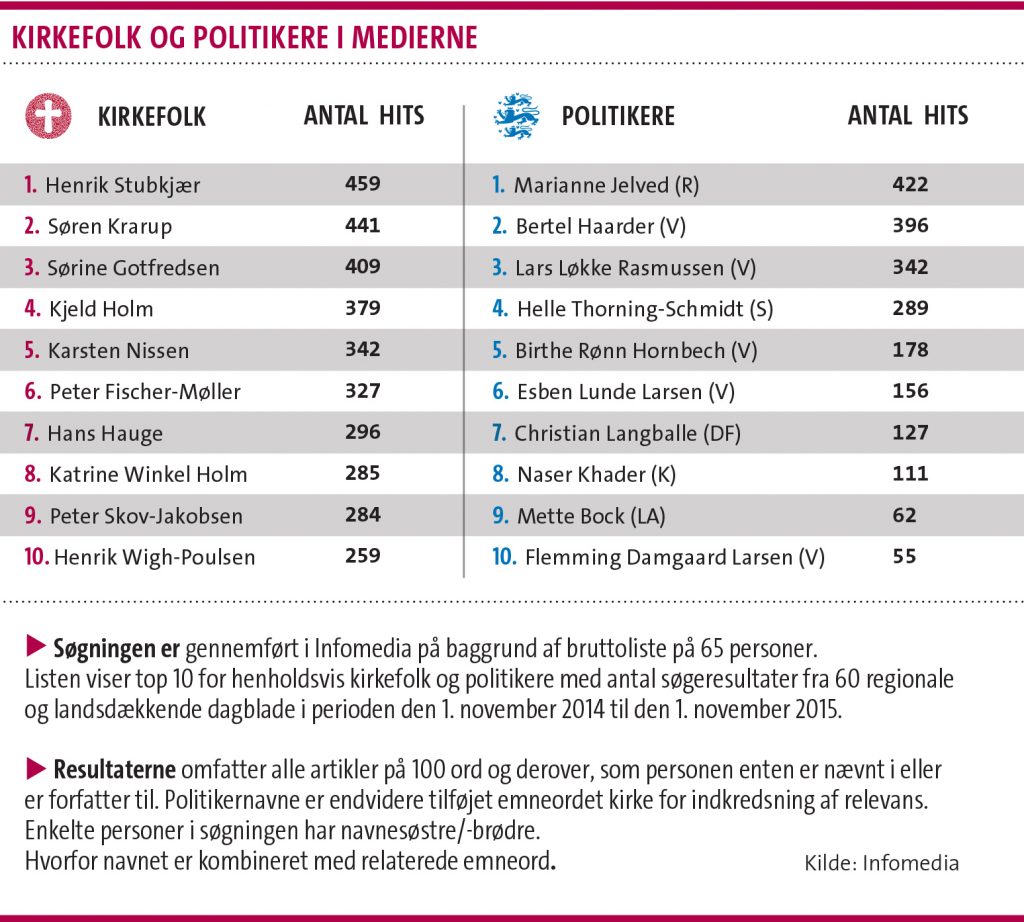
As employee I had to design Data Visualizations that makes abstract data understandable and accessible for the reader of the two newspapers.
Solution
The data visualizations created for Berlingske Tidende and Kristeligt Dagblad follows guidelines set by external and internal designers and aids the stories that they were brought in correlation with.